Python Examples
How to Install
To install the package from PyPI, call:
pip3 install deadwood # python3 -m pip install deadwood
Basic Use
Note
This section is a work in progress. In the meantime, take a look at the examples in the reference manual.
To learn more about Python, check out my open-access textbook Minimalist Data Wrangling in Python.
import numpy as np
import pandas as pd
import matplotlib.pyplot as plt
import deadwood

def permute_rows(X):
    return X[np.random.choice(len(X), len(X), replace=False), :]

def plot_scatter(X, labels=None):
    deadwood.plot_scatter(X, asp=1, labels=labels, alpha=0.3, markers='o', s=5)
Example noisy dataset[1]:
X1 = permute_rows(np.loadtxt("chameleon_t7_10k.data.gz", ndmin=2))
plot_scatter(X1)
plt.show()
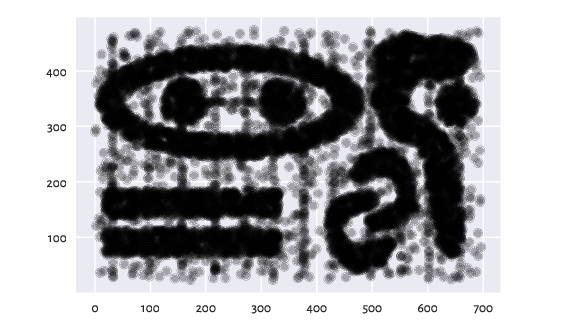
Figure 1 The chameleon_t7_10k dataset
Detect outliers with Deadwood (default settings):
is_outlier = deadwood.Deadwood().fit_predict(X1)
plot_scatter(X1, (is_outlier<0))
plt.show()
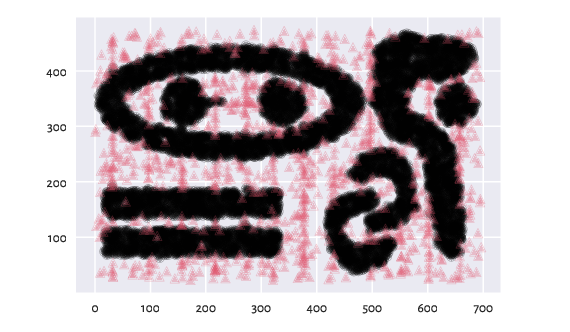
Figure 2 Outlier detection on chameleon_t7_10k
Fraction of detected outliers:
np.mean(is_outlier<0)
## np.float64(0.1014)
Clusters of Unequal Densities
The above dataset consists of clusters of relatively equal densities. Here is another one, where it is clearly not the case.
X2 = permute_rows(np.loadtxt("chameleon_t8_8k.data.gz", ndmin=2))
plot_scatter(X2)
plt.show()
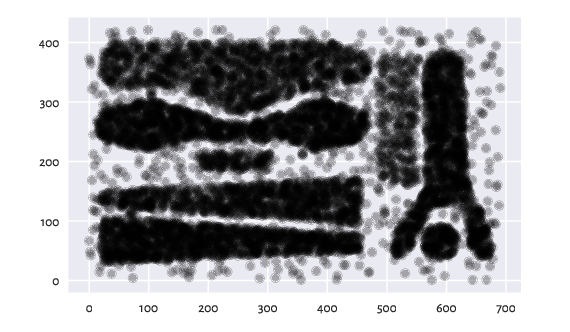
Figure 3 The chameleon_t8_8k dataset
Detect outliers with Deadwood (default settings):
is_outlier = deadwood.Deadwood().fit_predict(X2)
plot_scatter(X2, (is_outlier<0))
plt.show()
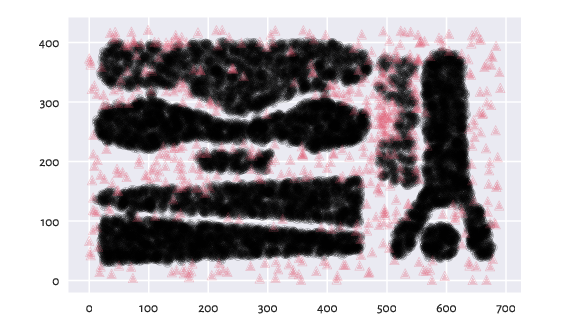
Figure 4 Outlier detection on chameleon_t8_8k
Detect outliers with Deadwood, separately in each cluster determined by Genie:
import genieclust
clusters = genieclust.Genie(n_clusters=8, gini_threshold=0.5, M=5).fit(X2)
plot_scatter(X2, clusters.labels_)
plt.show()
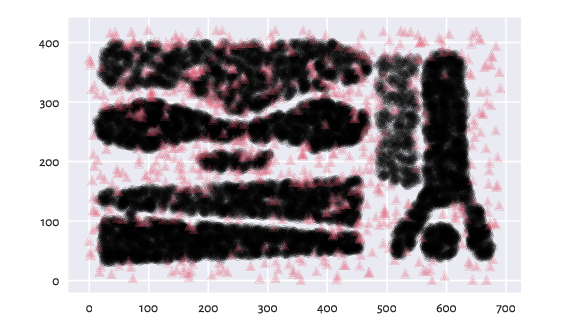
Figure 5 Detected clusters of chameleon_t8_8k
is_outlier = deadwood.Deadwood().fit_predict(clusters)
plot_scatter(X2, (is_outlier<0))
plt.show()
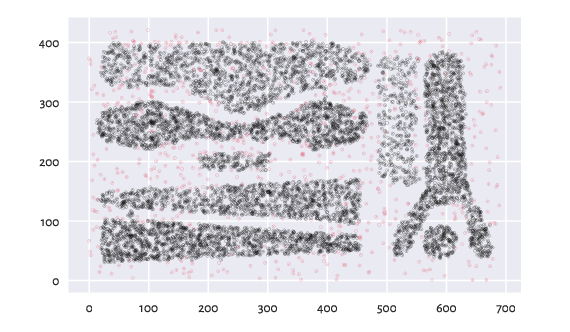
Figure 6 Outlier detection on clusters of chameleon_t8_8k