R Examples
How to Install
To install the package from CRAN, call:
install.packages("deadwood")
Basic Use
Note
This section is a work in progress. In the meantime, take a look at the documentation of the deadwood function.
To learn more about R, check out my open-access textbook Deep R Programming.
Example noisy dataset[1]:
X1 <- as.matrix(read.table("chameleon_t7_10k.data.gz"))
plot(X1, asp=1, ann=FALSE, col="#00000055")

Figure 8 The chameleon_t7_10k dataset
Detect outliers with Deadwood (default settings):
library("deadwood")
is_outlier <- deadwood(X1)
plot(X1, asp=1, ann=FALSE, col=c("#00000055","#ff333333")[is_outlier+1])
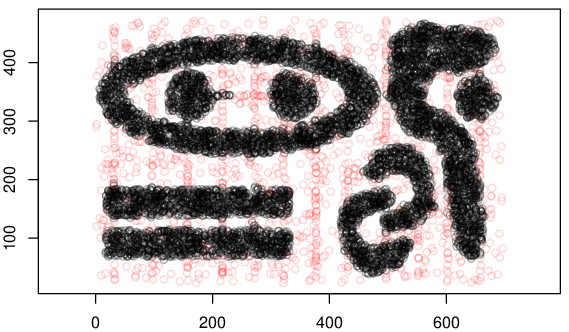
Figure 9 Outlier detection on chameleon_t7_10k
Fraction of detected outliers:
mean(is_outlier)
## [1] 0.1014
Clusters of Unequal Densities
The above dataset consists of clusters of relatively equal densities. Here is another one, where it is clearly not the case.
X2 <- as.matrix(read.table("chameleon_t8_8k.data.gz"))
plot(X2, asp=1, ann=FALSE, col="#00000055")

Figure 10 The chameleon_t8_8k dataset
Detect outliers with Deadwood (default settings):
is_outlier <- deadwood(X2)
plot(X2, asp=1, ann=FALSE, col=c("#00000055","#ff333333")[is_outlier+1])
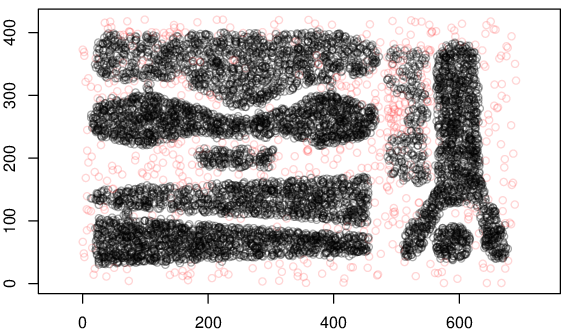
Figure 11 Outlier detection on chameleon_t8_8k
Detect outliers with Deadwood, separately in each cluster detected by Genie:
library("genieclust")
clusters <- genie(X2, 8, gini_threshold=0.5, M=5)
is_outlier <- deadwood(clusters)
plot(X2, asp=1, ann=FALSE, col=c("#00000055","#ff333333")[is_outlier+1])
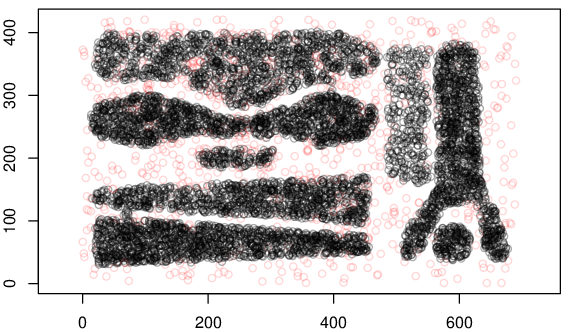
Figure 12 Outlier detection on clusters of chameleon_t8_8k